This Website
This website (and the talk) is focused on bringing attention to various home-made and Online tools which may enhance your awareness, understanding and appreciation of bird migration.
The layout of the site is this main column with some narrative and illustrative materials. The right-hand sidebars contain links to sites and materials discussed in the narrative (on some devices, the "side-bar" may appear as a box below the narrative).
The majority of the Online materials presented are products of the Cornell Lab of Ornithology. I present samples of their incredible work and links for you to engage with them directly. I use and support their materials on a regular basis. I suspect you may find some of them useful whatever your style of bird watching may be.
Field, Study & Listing
The essence of bird watching is spending time in the field. It is there that our senses can bring us into physical and emotional relationship with the birds and the web of life.
Whether "going out in the field" means looking out the window at your feeders or yard or walking around the block or driving to a nearby wetlands, questions inevitably arise.
Curiosity eventually results in multiple field guides and often a shelf of books on everything from migration to nest building.
Lists start appearing, whether just as mental recollections or checkmarks in a field guide to detailed trip reports on eBird.
The interplay between field-time and study-time drives an ever-expanding awareness, understanding and appreciation.
The sidebar for each section of the narrative has links to external websites and some additional information.
For the functions used on this website, you will not need a Cornell password. But for full functionality of everything in eBird, you will need to open a free account.
Overview
Bird migration (like all movement) involves the passing of time and change in position (location).
- Timing: Based on the near clock-like orbit of the tilted Earth around the sun resulting in:
- Cyclical changes in Day Length.
- Cyclical changes in temperature and insect activity.
- Cyclical changes in energy available for primary production in the food web.
- Locations: Areas with a mix of habitats capable of providing for the needs of the migrant.
- Breeding Grounds
- Stopover Locations
- Wintering (non-breeding) Grounds
These two themes, timing and location, are explored in the sections below.
Planetary Motion
The yearly shape of migration is provided by the orbit of the earth around the sun
BUT
ONLY because of the tilt of the earth's axis relative to the orbital plane*:
- Northern Summer Solstice: Sun directly above Tropic of Cancer
- Northern Winter Solstice: Sun directly above Tropic of Capricorn
- Spring and Summer Equinoxes: Sun directly above the Equator
The daily shape of migration is a result of the rotation of the earth about its own axis:
- Day: Heat, Turbulence, Wind, Updrafts and Thermals - Favors Soaring & Gliding Migrants
- Night: Cool, Less wind, Laminar air flow - Favors Self-powered Migrants
*Note: We are actually closer to the sun during our winter than during our summer!
The daily and yearly cycles dictated by the Earth's movements have shaped life on Earth. In a universe of temporary equilibria, these movements provide humans with a sense of stability.
Religions have liturgical calendars and daily devotional activities tied to these movements. Indigenous peoples have ceremonial and subsistence cycles tied to these planetary movements.
There are Spring festivals and Fall festivals, Winter and Summer festivals -- Spring traditions and Fall traditions and traditions for each solstice.
We share deep evolutionary and ecological roots with birds.
In our not so distant past, we too lived wild on the land, our survival inextricably linked to seasonal activities and movements.
I suspect that the birds, making their daily and yearly rounds -- flying, singing, eating, having young -- contemporary hunter-gatherers -- so beautiful and visible -- remind us of our own subsistence past, making our yearly rounds.
Go to a brief explanation of earth's seasons from NASA.
Earth's Atmospheric Boundary Layer: Why some birds migrate during the day and others at night.
Explore our evolutionary/ecological connection with birds.
This was written relative to the Rio Fernando Wetlands in Taos but is applicable to any location.
A brief account of Spring migration at one location in New Mexico:
- As summer ends, song declines. By the winter solstice the only song is that of the Townsend's Solitaire; its gentle, rambling, fluttering song given occasionally between its more consistently repeated long series of single-pitched whistles. (This winter visitor will depart for higher elevations no later than early June.)
But after the winter solstice, we enter the period of increasing day-length. In the next week or two, for the first time since the late summer, the Black-capped Chickadee gives its two note "fee bee".
By February, the House Finch conversation gets more lively and occasionally one gives the up-slurred ending not heard since the end of breeding activities last summer. The Spotted Towhee, only detectable on the Christmas Bird Count by its subtle contact growl, gives the occasional "chup chup chup cheeeese".
By March, I anticipate two new sounds on a morning walk. Without fail, in the first two weeks of March, I will hear the Black Phoebe's two-note "pit-whit" from the willows at the river's edge and from a fencepost in the fields around me, the plaintively slurred "pit-peeeeuuur" of the Say's Phoebe.
The last two weeks of March will bring:- Turkey Vulture
- Chipping Sparrow
- Violet-green Swallow
- Barn Swallow
- Hummingbirds begin to appear.
- If I'm lucky, I'll see a Caliope Hummingbird
In April, almost every species that's coming or passing through, makes an appearance.- -When the Cottonwood buds are about to pop the Yellow-rumped Warbler sings.
- -One week or so later I'll hear the gentle "Chi beer" of the Ash-throated Flycatcher.
- -And when the cottonwood leaves are out: the faster-than-you-can-say-it "sweet, sweet, I'm so sweet!" of the Yellow Warbler
By mid-May as the migration peaks, the soundscape is transformed by song.
My summer morning chorus will include many species but will be dominated by two: one a migrant summer breeder, the Yellow-breasted Chat; the other a year-round resident, the Spotted Towhee. I have no way of knowing if this individual has been here all winter or whether it has just flown in after wintering in Texas.
The summer songs will begin to decline in July, slowly fading away with the coming of Fall.
Recordings of these two species, made from my front porch, are available in the side bar (or the box below).
Here is a chart which shows arrival times at my particular location (Enlarge Chart):![]()
See photos of Species mentioned in the migration description.
Links to Arrival Charts:
Short recording of Yellow-breasted Chat from my front porch:
Long (unedited) recording of Spotted Towhee from my front porch:
Online Field Guide with Recordings and Photos:
All About Birds from Cornell
Bar Charts
Perhaps you would like to have a chart like the one above for your location, your 'local patch'?
Here are some ways to do that:
Do it yourself: The chart above was originally created from data I collected on paper charts. When I first retired, I walked a one-mile-long segment of road in front of my house for 2-3 hours 3-5 days a week for several years.
The chart simply had 52 cells across, one for each week with labels showing the start date for each week. It could have been simpler, with just 12 cells across, one for each month or more complex with daily boxes.
Whatever resolution one chooses, the migratory situation will begin to reveal itself as the seasons change. Even the most casual record-keeping will bring attention to all manner of details one might otherwise miss.
Another bonus: I was a novice birder when I started this process on my road, but after a couple of years I knew most of the birds and many of their songs.
Using eBird Bar Charts: Many local birding locations already have a bar chart available. (Bar Charts are available in eBird under the 'Explore' tab.)
Click here for a Bar Chart for all of Santa Fe County
You can also get Bar Charts for more specific locations by choosing from NM "Hotspots".
(This is just a PDF. Go to eBird to actually select a hotspot.)
As an example, Click here for the Bar Chart for the Randall Davies Audubon Center.
In the very bottom right of the Bar Chart there is a link for downloading the Histogram Data from which the chart is built. Manipulating the data in a spreadsheet can be very instructive.
Click here to see the Randall Davies Bar Chart data sorted by season in Excel.
In the side-bar (or the box below) are links to the Histogram Data for the Randall Davies Bar Chart and also a link to download an already processed Spread Sheet version (Excel).
Create a personal location on eBird: You can create an eBird location of your own (your back yard or front yard or block or segment of the Santa Fe River or...). eBird will generate the bar chart for you.
Here is a link to a bar chart for one of my locations: NM-RioArriba-Dixon-PCFW (Point Count Front Wall). I started doing once a week 10-minute point-counts starting 4 minutes before sunrise in early 2020 and have continued to the present. I just sit on a low wall in my front yard.
To get a Bar Chart on eBird:
- Go to eBird.org
- Go to "Explore".
- Go to "Bar Charts".
- Choose a Location .
The eBird site has all kinds of tutorial help available!
At the bottom of any eBird Bar Chart is a button for downloading the Histogram Data used in making the chart. The following PDFs show the Randall Davies data sorted in various ways:
Bar Chart for Randall Davies (Spreadsheet Form - PDF):
- Randall Davies BarChart - Sort: Taxonomic Order
- Provides a very rough estimate of abundance:
- Randall Davies BarChart - Sort: Histogram Values
- Randall Davies BarChart - Sort: Seasonal Status
Download Excel version of Randall Davies Bar Chart:
Click here for an example of how a monthly observation at one location can reveal the migratory movements of birds.
Migration View
Using the Bar Charts it becomes clear that we can sort local birds into these four categories:
- Species present All Year
- Winter Visitors
- Spring & Fall Transients
- Migrant Summer Breeders
This link takes you to a page that provides a 'schematic' model of migration: Migration View
The numerical values used are from bar chart for the Randal Davies Bar Chart.
Solar Flux across the Seasons
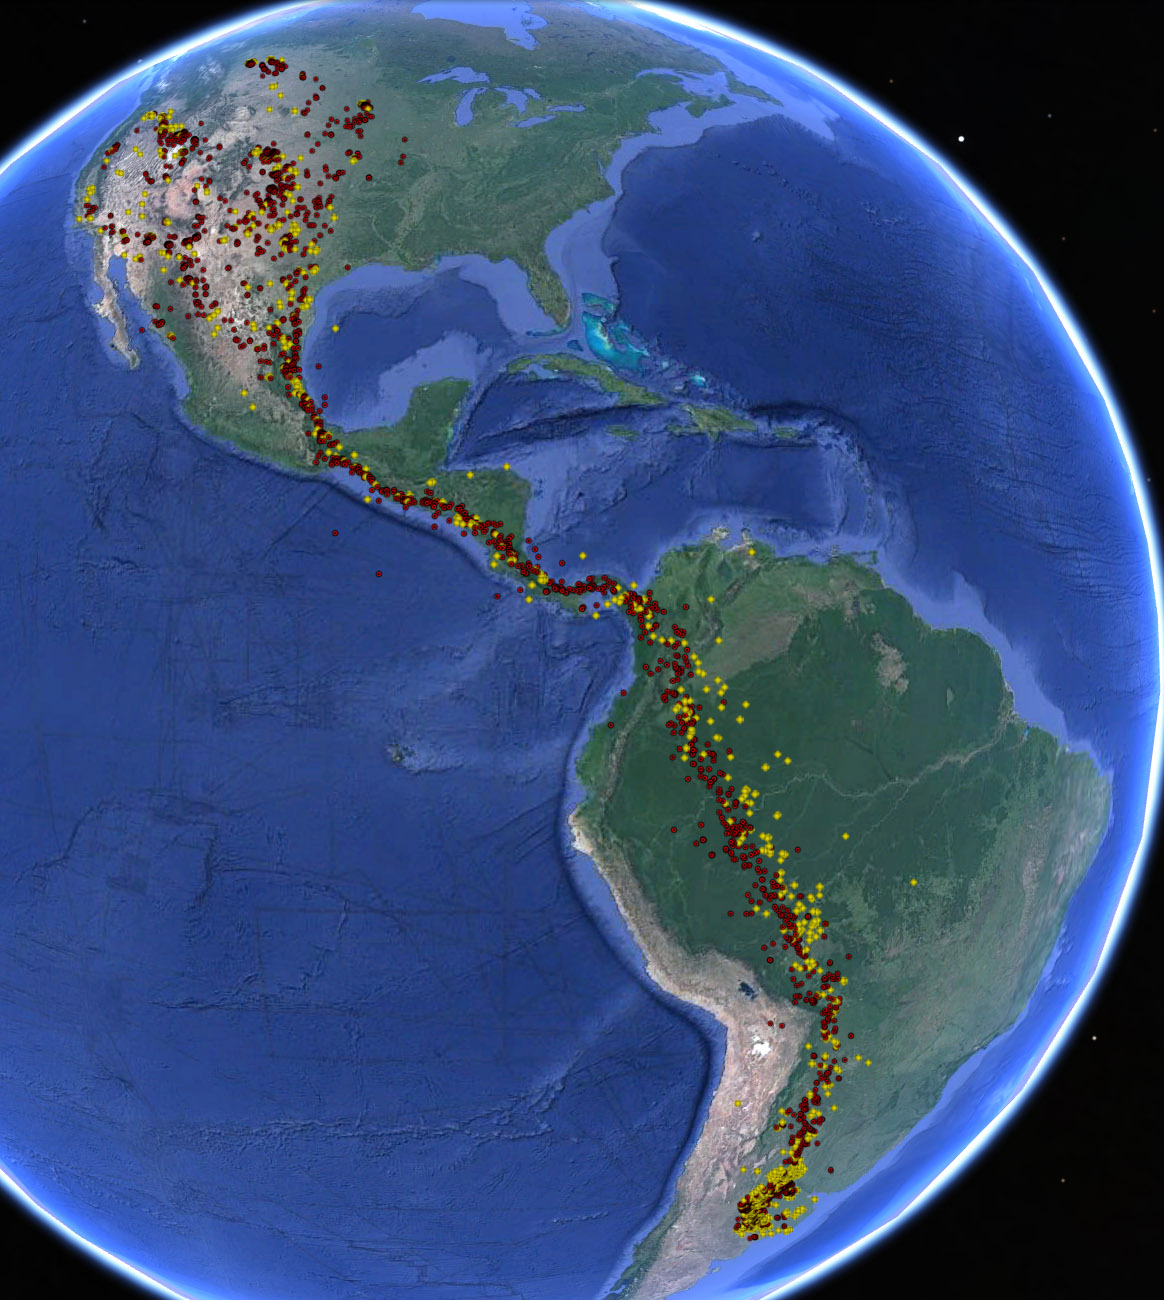
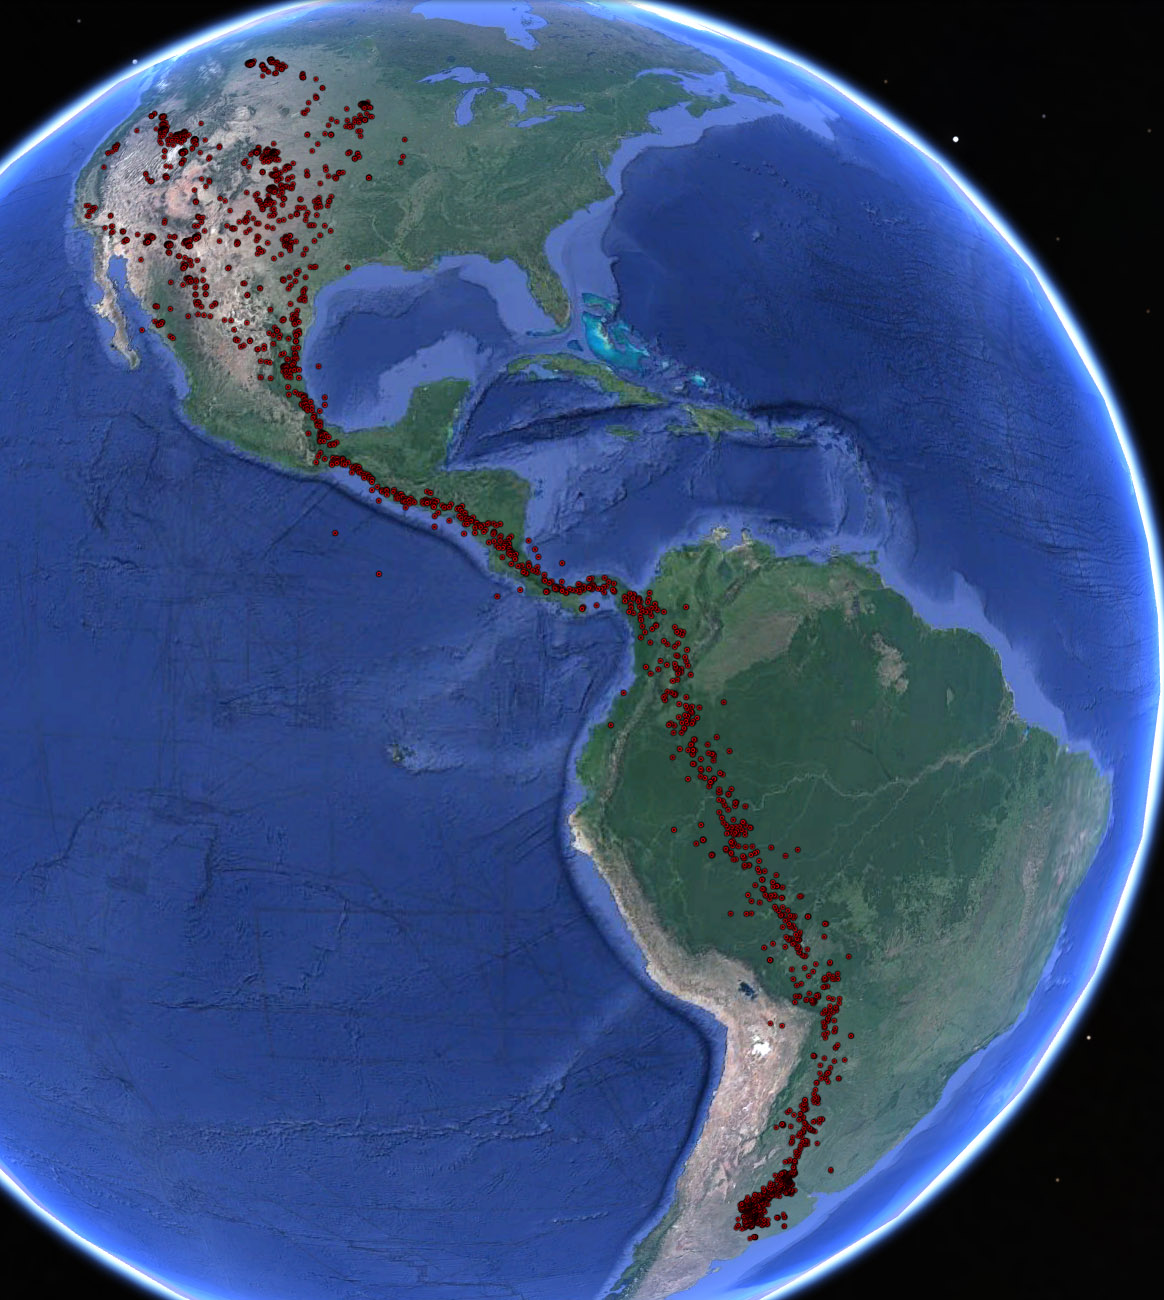
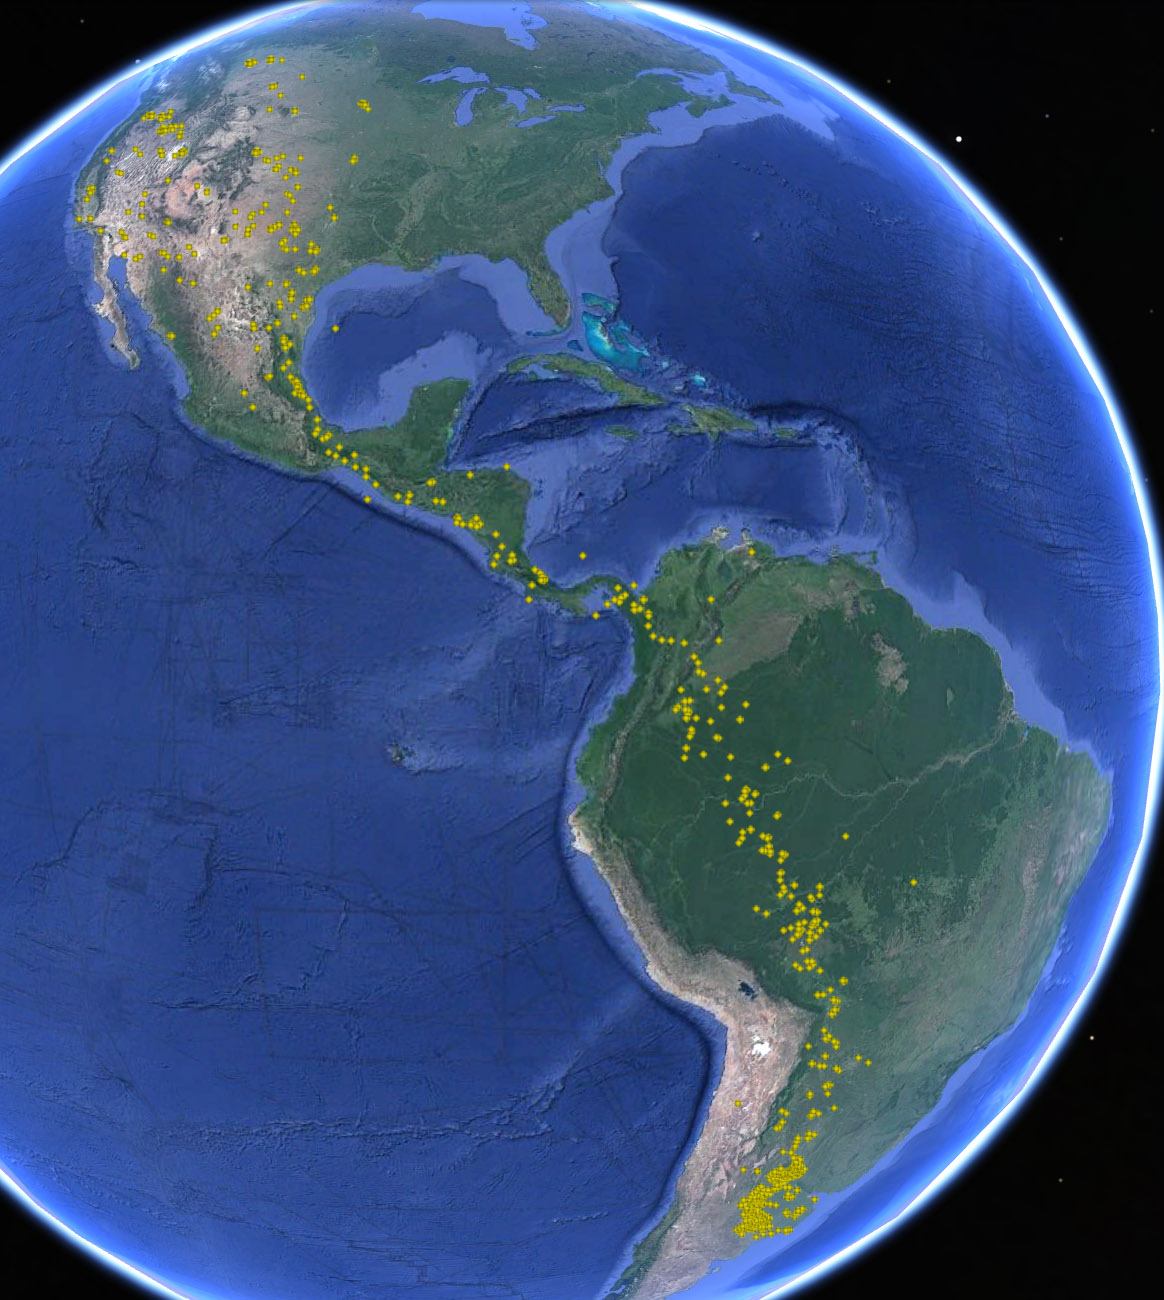
On the satellite earth image below are plotted positions of Swainson's Hawks at various times of the year. The red points are from July through December. These points include the two-month long southbound Fall migration. The yellow points are from January through June, including the two-month long Spring northbound migration.
The data are from 43 satellite-tracked, radio-tagged Swainson's Hawks. The data were gathered from 1995-1998.
For most of the hawks, the migration route is more than 6,000 miles long.
Summers spent in North American plains (think grasshoppers!).
Our northern winter passed in the southern summer on the pampas de Argentina (grasshoppers again!)
SWHA Data: Fuller, M.R., Seegar, W.S., Schueck, L.S., 1998. Routes and Travel Rates of Migrating Peregrine Falcons Falco peregrinus and Swainson's Hawks Buteo swainsoni in the Western Hemisphere. Journal of Avian Biology 29:433-440.
This graph shows the available solar radiation available at each point on the earth throughout the year.
The upper left quadrant depicts our northern Summer.
The lower right quadrant depicts the southern Summer (our winter).
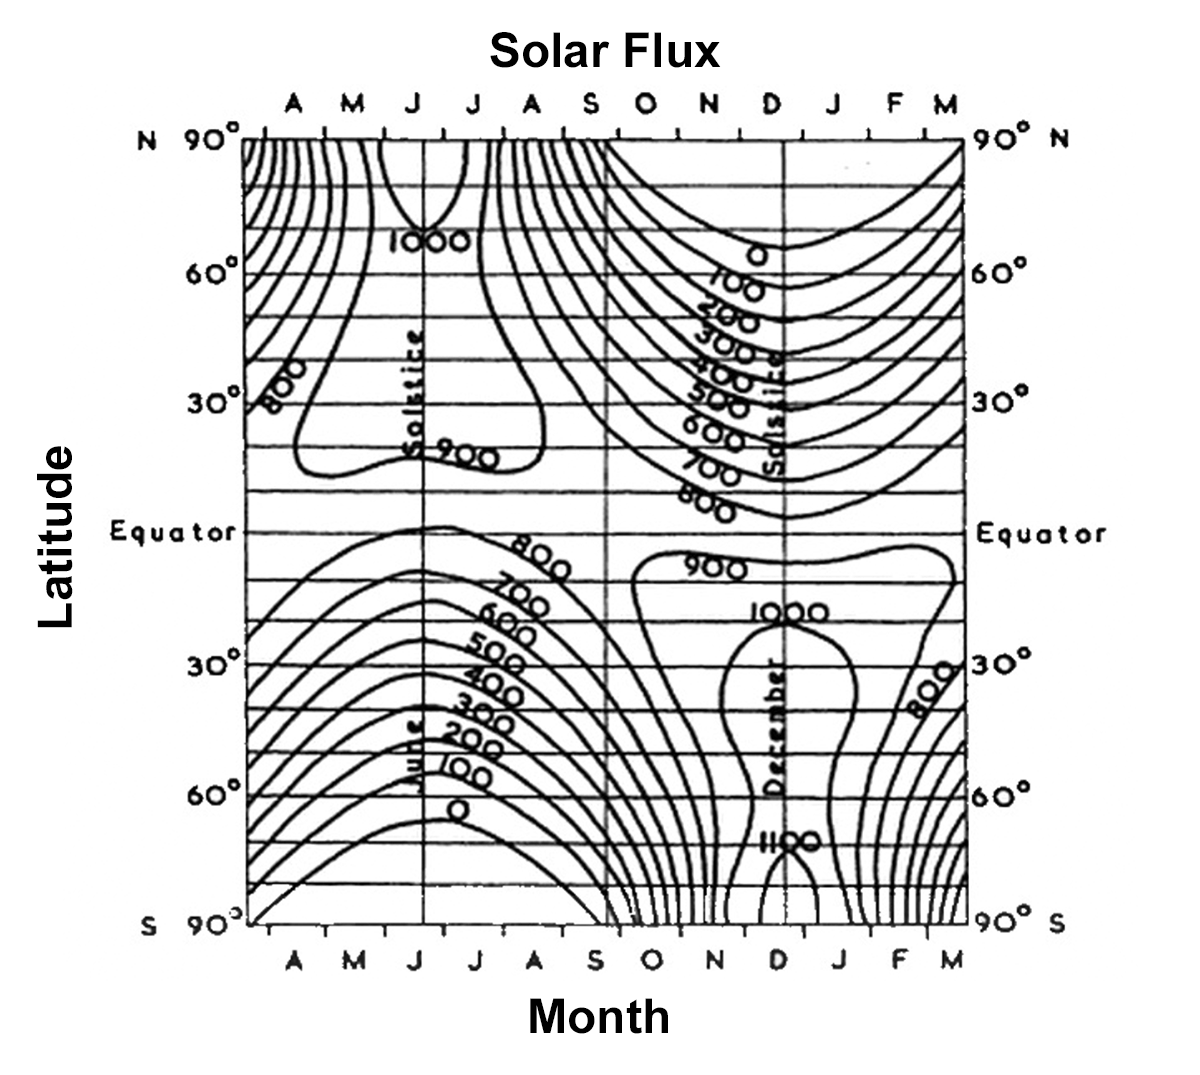
(Graph Units: g cal/cm2 )
Solar Radiation Graph adapted from Lamb, H. H. 1972. Climate: present, past and future. Vol. 1.
How might the Swainson's Hawk data fit with the Solar Flux graph?
Here is the same Solar Flux graph with each Swainson's Hawk's position plotted in blue by latitude and date.
[The lack of data in late June and early July is just an artifact of the logistics of the research. The birds are there!]
Some details:
-The Spring migration (March & May) is more diffuse than the Fall migration (September & October).
-On their North American breeding grounds, the birds are spread across 25 degrees of latitude (30 deg N to 55 deg N), while on the wintering grounds, the birds are less dispersed ( 30 deg S to 37 deg S).
-Overall, the timing of migration, is quite uniform: about 2 months in each direction.
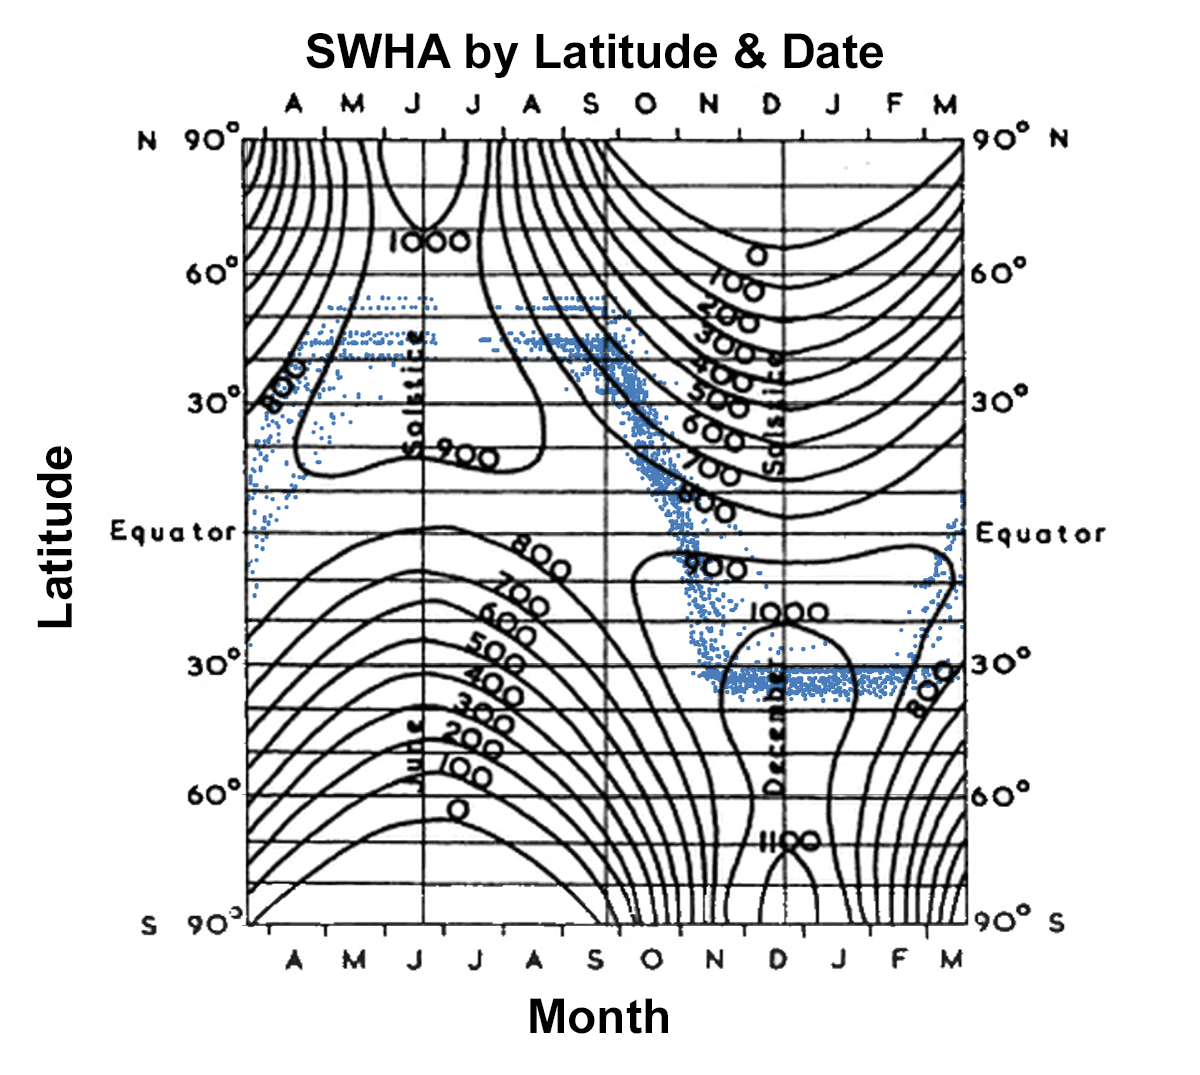
Changes in day length in the Fall and Spring play a role in triggering migration. The more constant day length around the Summer Solstice provides a time of relative stability for nesting and helping young to fledge.
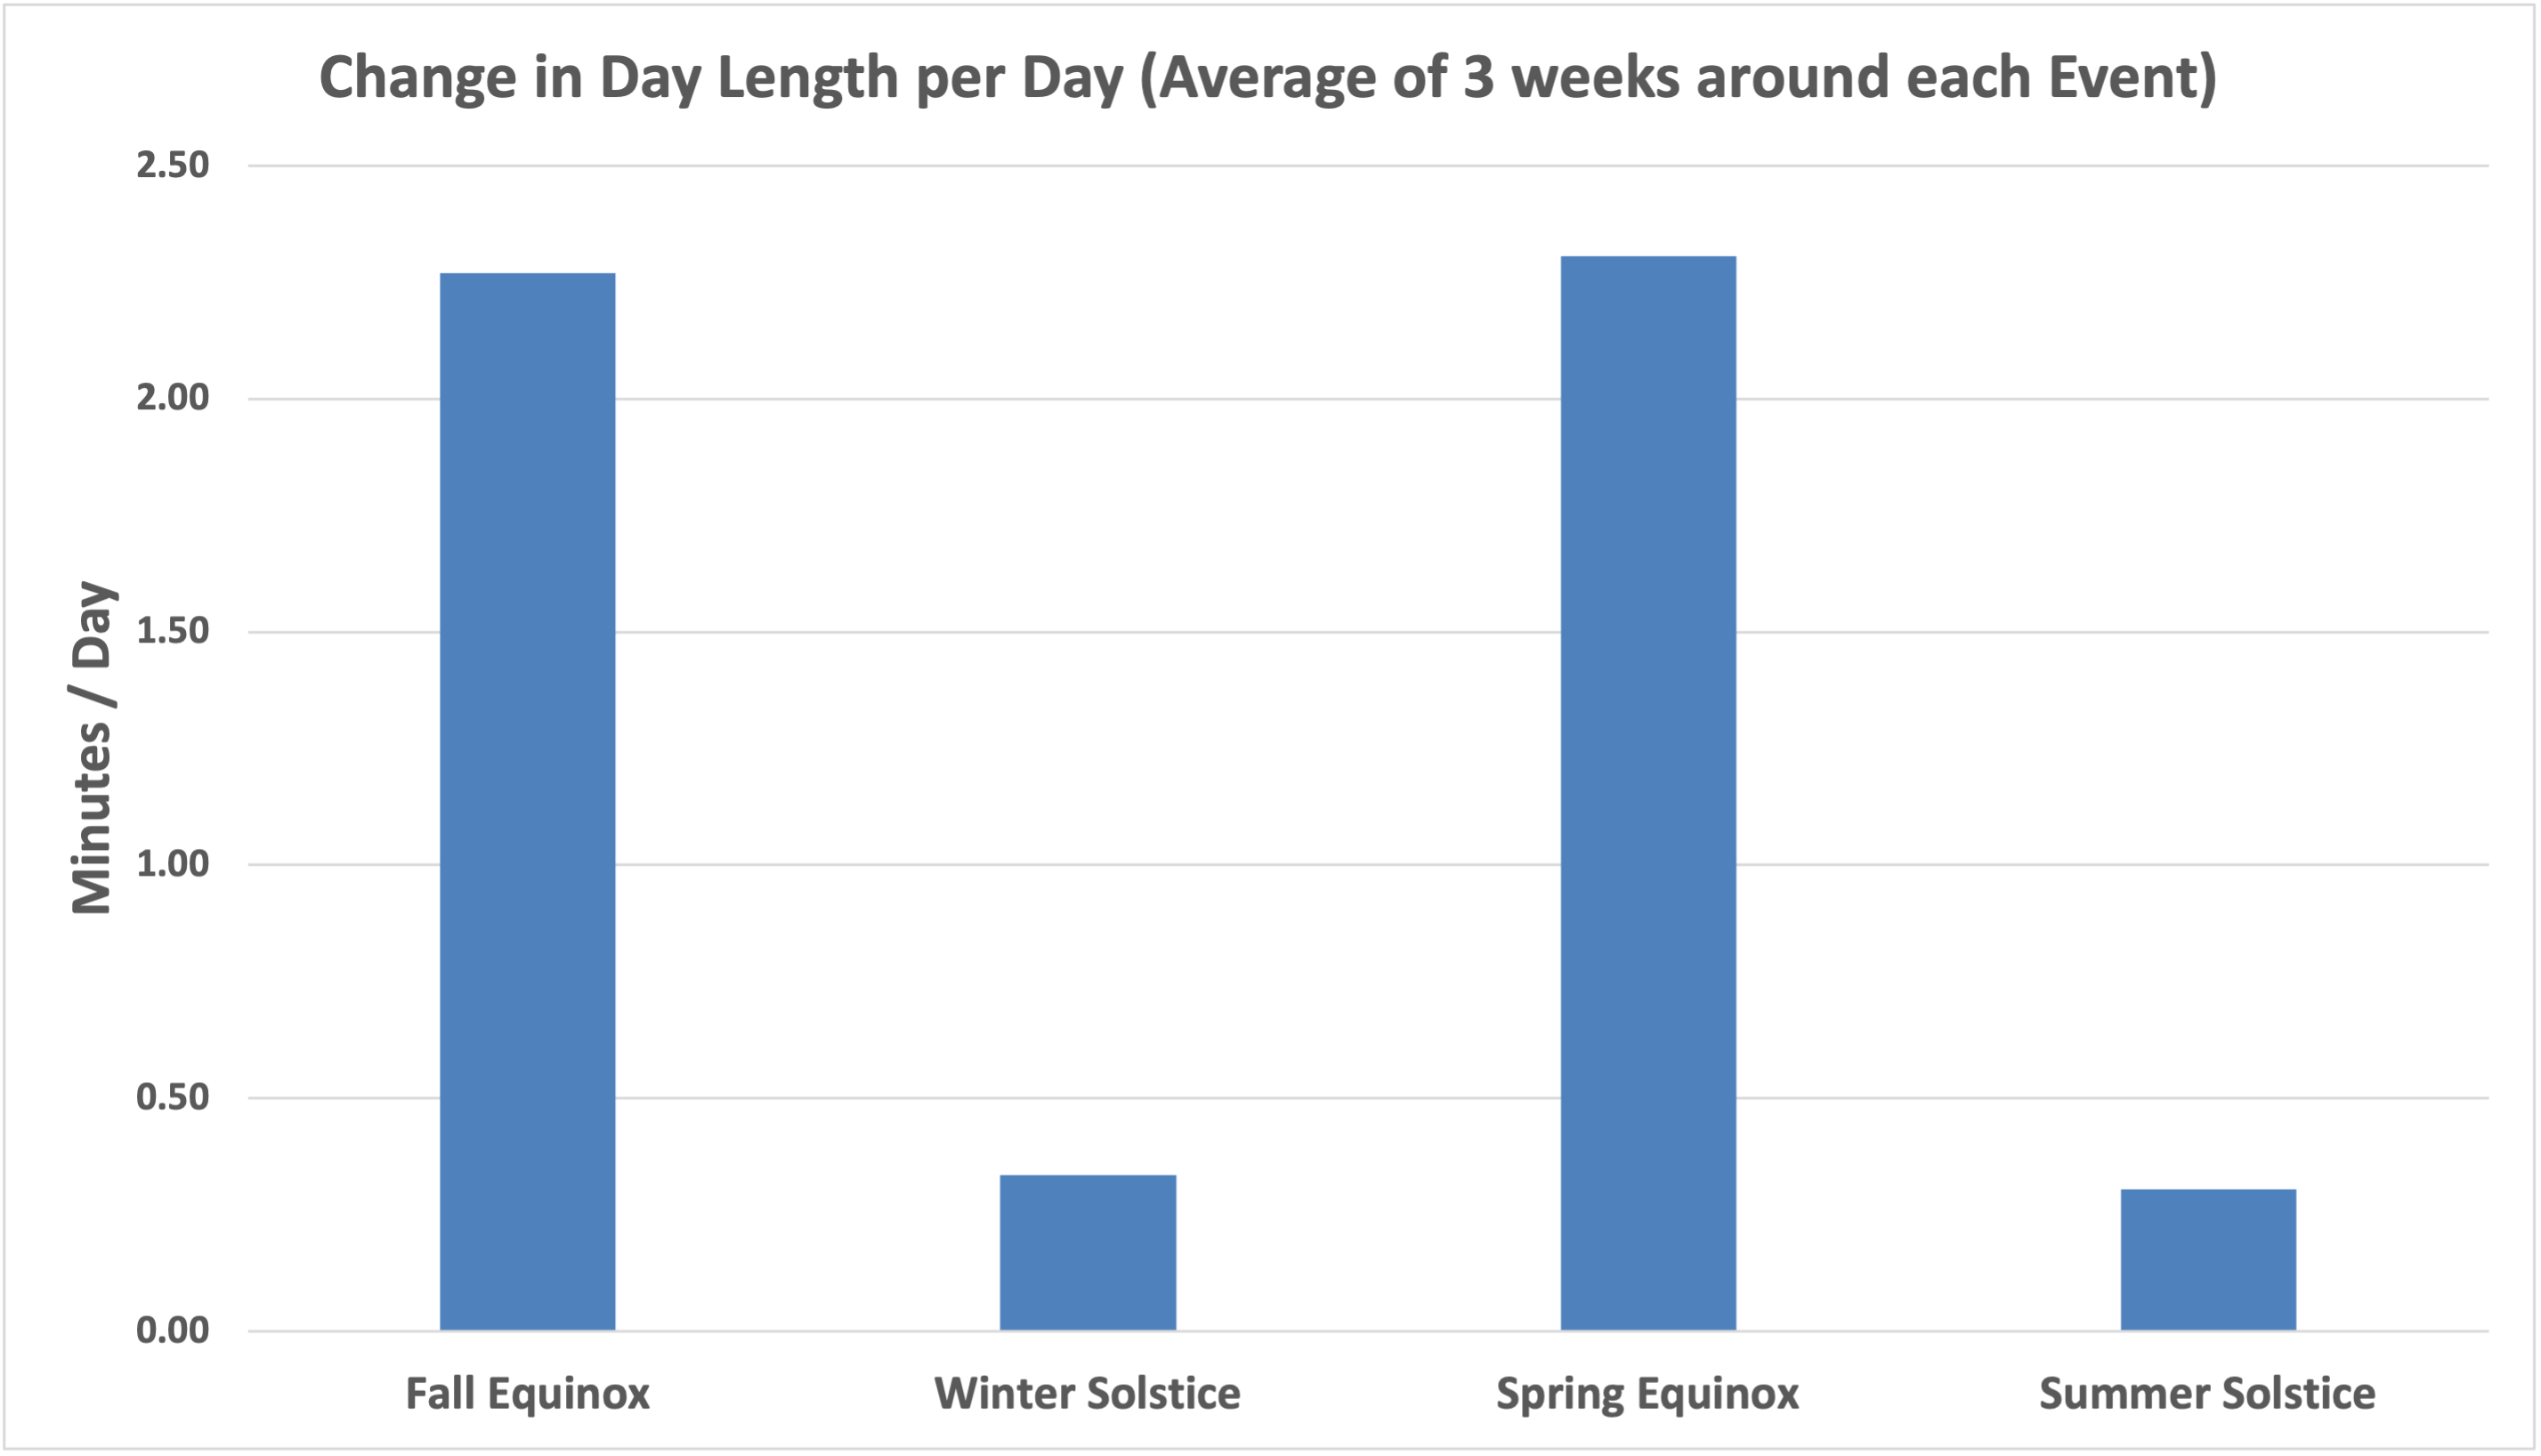
In the three weeks surrounding the Spring and Fall Equinoxes, the length of day is changing rapidly.
During the three weeks surrounding the Summer and Winter Solstices, the length of day is changing only slightly.
Just as the timing of the earth's movements are very regular (at least as far as we can perceive), the timing of a given species movements ( at a population level) are amazingly regular as well.
90% of the Swainson's Hawks pass the count site between the dates denoted by each years box.
Earliest red line: Average of 5% values.
Blue Line: Average of median (50%) values.
Latest red line: Average of 95% values.
Graphs of the four principal raptors recorded at the VRR are available in the side-bar.
These two sites provide access to migration/movement data on many different species of birds and other creatures. You can view the data mapped online or download it for your own experimentation.
The Swainson's Hawk data is from:
MoveBank.org
Another site for Radio-tagged individuals:
Sea Turtle: Swallow-tailed Kite
Additional Swainson's Hawk Views:
South Bound (Fall):
North Bound (Spring:)
Click here for a brief article about Changes in day-length and bird migration.
For each Species, for each year:
- -Beginning of box: 5% of the individuals have past.
- -End of box: 95% of the individuals have past.
- -The line in the middle: 50% of the individuals have past.
- Earliest red line: Average of 5% values.
- Blue Line: Average of median (50%) values.
- Latest red line: Average of 95% values.
Some recommended reading sources on Bird Migration:
The Basics Of Bird Migration: How, Why, And Where (at AllAboutBirds.org)
How Birds Migrate by Paul Kerlinger and Pat Archer. Stackpole Books 2008
Living on the Wind: Across the Hemisphere With Migratory Birds by Scott Weidensaul
North Point Press 2000
General Introduction to raptor migration:
Migrating Raptors of the World: Their Ecology and Conservation by Keith L. Bildstein Comstock Publishing Associates 2006
Foundational Text on details of raptor migration:
Flight Strategies of Migrating Hawks by Paul Kerlinger University of Chicago Press 1989
Range Maps, Abundance Maps & Abundance Animations
Solid Color Range Maps encode location and time. They provide a good starting point for understanding and appreciating bird migration. However, there are many local geographical details that are not discernible, such as elevational migration.
Putting together a range map is not a trivial task. Traditionally it has required extensive literature searches and a lot of informed guessing.
Enter eBird! The extensive data set of observations from across the Americas (as well the rest of the world) has taken range maps to new levels of detail. This section will introduce some of the phenomenal freely accessible products Cornell's Lab of Ornithology is producing.
Example: A Complete Migrant
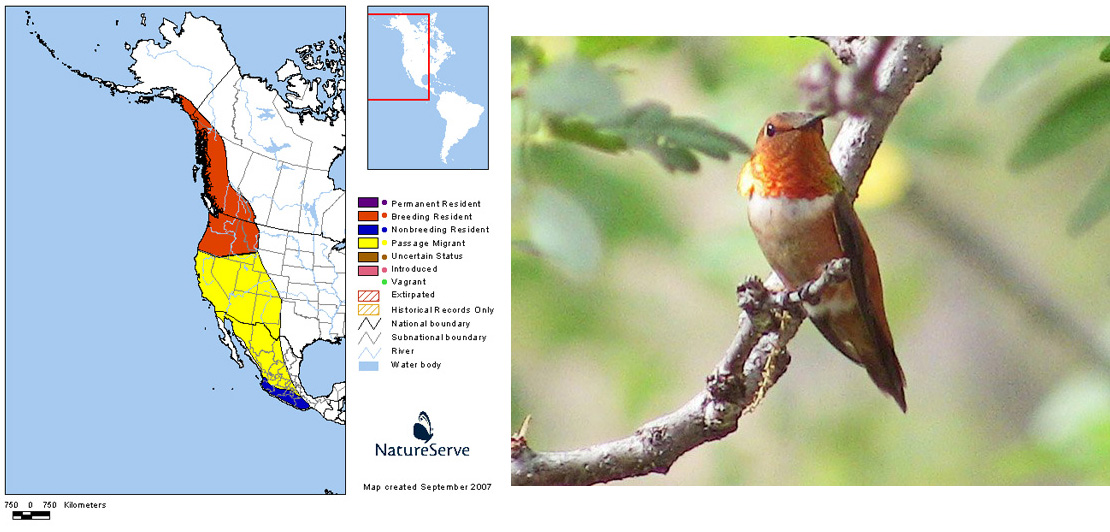
Here is a typical solid-colors range map for the Rufous Hummingbird.
The Rufous Hummingbird is a "complete migrant". There is no overlap between its breeding (red) and wintering (blue) grounds.
It migrates twice yearly through the yellow area of the map. But does it? In New Mexico, the Rufous Hummingbird is associated with a July 1st arrival for the year. Much too late for getting to its May-June Breeding grounds.
The details of the Rufous Hummingbird migration are revealed by the eBird maps:
From the eBird Science link, under eBird Status and Trends, you will find these range maps:
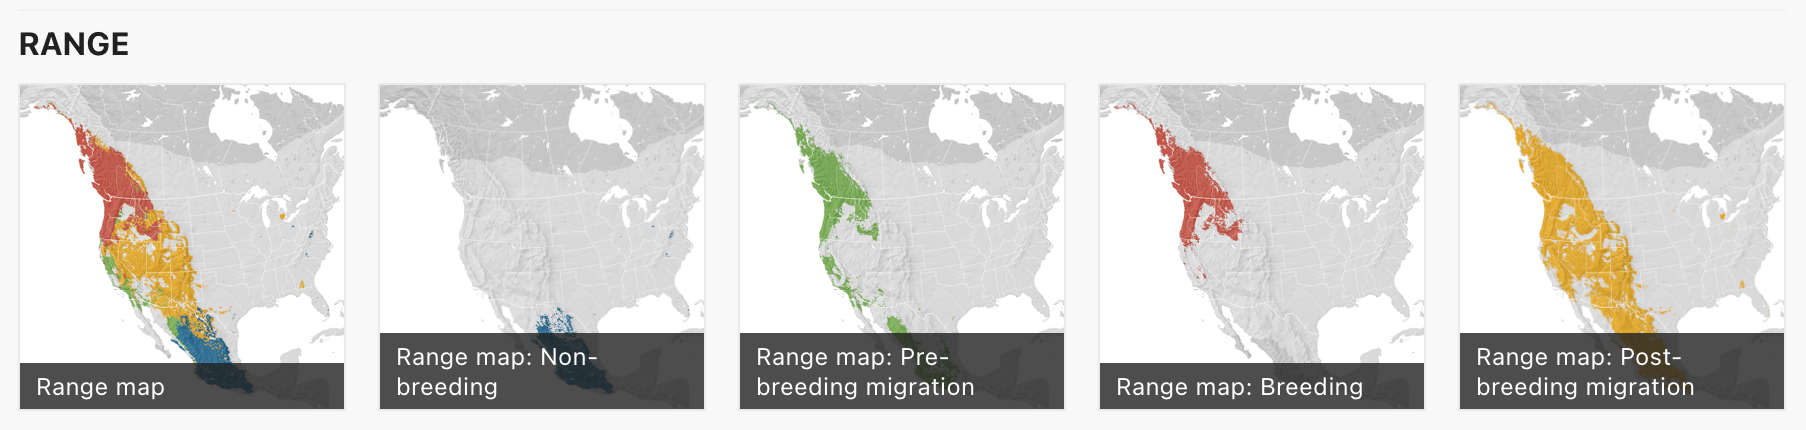
Here is the one on the left that combines all of the seasons.
It clearly shows the Spring (northbound) migration along the coast
and the Fall (southbound) migration inland, including NM:
For still more detail, there is an "Abundance Map":
And then, to take the data into the realm of art, an "Abundance Animation":
Example: A Partial Migrant
Here is a typical solid-colors range map for the American Robin.
The American Robin is a "partial migrant". Some populations are migrant, others are not.
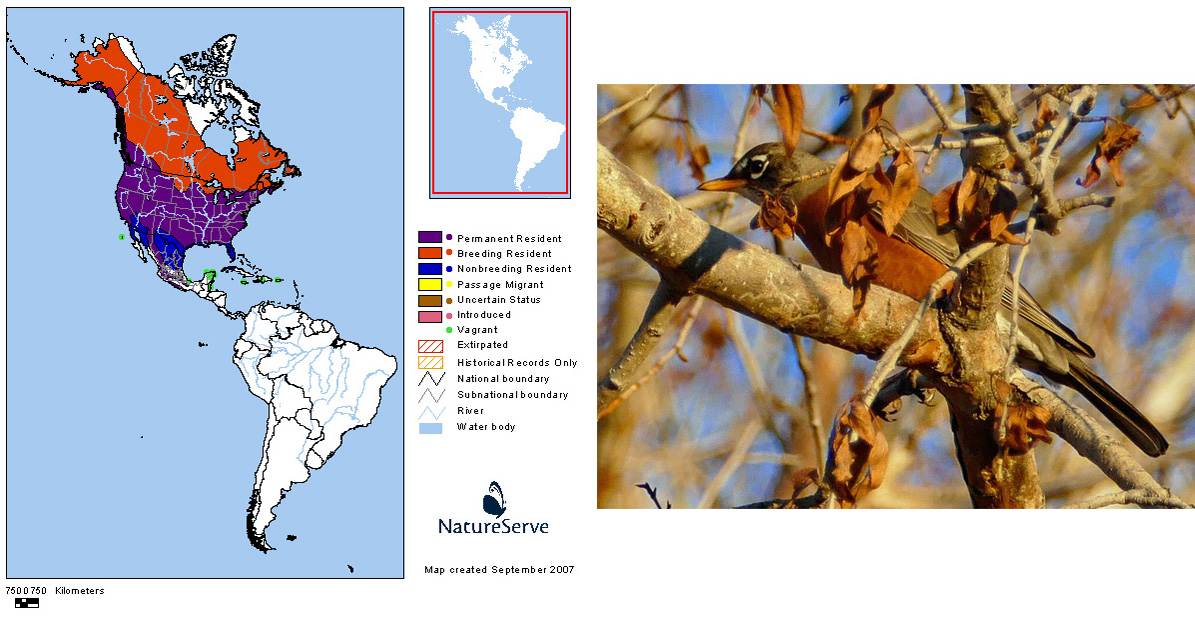
Here is the Range Map:
Here is the "Abundance Map":
And here is the "Abundance Animation":
To get a Range Map, Abundunce Map or Abundance Animation on eBird:
- Go to eBird.org
- Go to "Science".
- Go to "eBird Status and Trends".
- Choose a Species (FYI: You can use 4-Letter Codes in the search box.) .
The eBird site has all kinds of tutorial help available!
NatureServe Range Map Credit:
Range data provided by Infonatura/Natureserve. Ridgely, R. S., T. F. Alnutt, T. Brooks, D. K. McNicol, D. W. Mehlman, B. E. Young, and J. R. Zook. 2005 Digital Distribution Maps of the Birds of the Western Hemisphere, version 2.1 NatureServe, Arlington, Virginia, USA
BirdCast
Every night during the migration, there are millions of songbirds in flight.
BirdCast is a radar-sourced migration monitor providing both predictive forecast maps and live migration maps.
Below are three examples of live migration maps. One from January, 2021 and two from May, 2021.
Click here to go to BirdCast to see more!
In the video, the red line that sweeps across from east to west marks sunset.
The yellow line marks sunrise.
Map from January 1, 2021:
Map from May 1, 2021
This map from May 13, 2021 is at the approximate peak of spring migration:
BirdCast Credits: BirdCast is a consortium of interdisciplinary researchers. The Core Partners are: Cornell Lab of Ornithology, Colorado State University and the University of Massachusetts Amherst.
Climate Change
Bird migration as we know it is based on the currently existing conditions. It was different at earlier points in time and it will be different at later points in time.
The timing related to Earth's planetary movements are changing, but on a very long timescale.
But changes in human land-use and changes in climatic conditions are both changing on a much shorter timescale.
This dissonance between timescales results in "migratory timing mismatches". Birds that have been relying on a given food resource at a particular stop-over, breeding habitat or wintering habitat can be confronted with a needed resource not being available at the right moment (climate change) or finding the source of the resource having been destroyed (land-use change).
In the case of a stop-over, an individual may not have the fitness to reach the breeding or wintering location. In the case of land-use change, an individual may not be able to find suitable habitat for breeding or winter foraging during the time it is needed, since that time is fixed by the availability of solar energy at that location.
Such mismatches are being documented on an ongoing basis as well as range expansions and contractions. In this time of rapid climate change, the changes in migration will undoubtedly accelerate.
For Questions or comments email Robert Templeton at rt@rioembudobirds.org.